

Contact:
rita.gautschy-at-unibas.ch
Canon of solar eclipses from 2501 BC to 1000 AD
Introduction
Historical chronolgy is based on a tight relationship between theoretical astronomy and historical events. The benefit of astronomy for chronology is that it is able to pin down astronomical events that were recorded in antiquity. Most important in that respect are solar and lunar eclipses, first and last sightings of the Moon after or before new moon, as well as observations of the planets Mercury, Venus, Mars, Jupiter and Saturn.
Due to their rare appearance at a particular site, solar eclipses have the greatest potential to provide a reliable date of a historical event, accurate to one day if a total or nearly total coverage of the Sun by the Moon has been passed down to us.
Features of a considerable eclipse of the Sun are:
- During a total solar eclipse the brightness of the sky changes drastically, but not evenly. Day can almost change into night. The change of brightness ist most noticeable shortly before and after maximum eclipse.
- The brightest fixed stars and planets may become visible in the vicinity of the eclipsed Sun.
- Shadows get sharper. Images of the eclipsed Sun can be observed on the ground in the vicinity of trees and bushes due to the pinhole effect.
- The temperature decreases during a total solar eclipse. Birds stop singing, blossoms close their leaves, diurnal animals retreat and nocturnal ones get active.
- At the beginning and at the end of totality, Bailey's beads can be observed for a short time: the last, respectively the first rays of sunlight shine through the valleys of the mountainous Moon silhouette causing the impression of beads.
- The solar corona appears around the dark disk of the Moon during totality.
Before 1000 AD only occurrences of points 1) and 2) are mentioned in historical sources. Concerning point 2) one must mention, that ancient writers often reported that stars were visible although today's calculations show unambigously that this was impossible. The description that day turned into night may thus be a more reliable hint that an eclipse had been total at a certain site. The report of the visibility of stars during solar eclipses may more likely be regarded as standard phrase to emphasise the dramatic event. Strikingly, solar and lunar eclipses are often mentioned in connection with destructions that occurred during earthquakes, with comets, or with other events that were regarded as bad auguries - this still happened at times when people already understood what caused eclipses.
Total solar eclipses are rare events. Although they frequently occur somewhere on Earth they recur at any given place, on the average, only once every 375 years. If the numbers of annular eclipses are added, the value decreases to about once every 140 years [1].
Geometry and main characteristics of a solar eclipse
As seen from the Earth, a solar eclipse occurs when the Moon passes between the Sun and the Earth, and when the Moon fully or partially covers the Sun. This hence only happens if Sun, Earth and Moon align along a straight line.
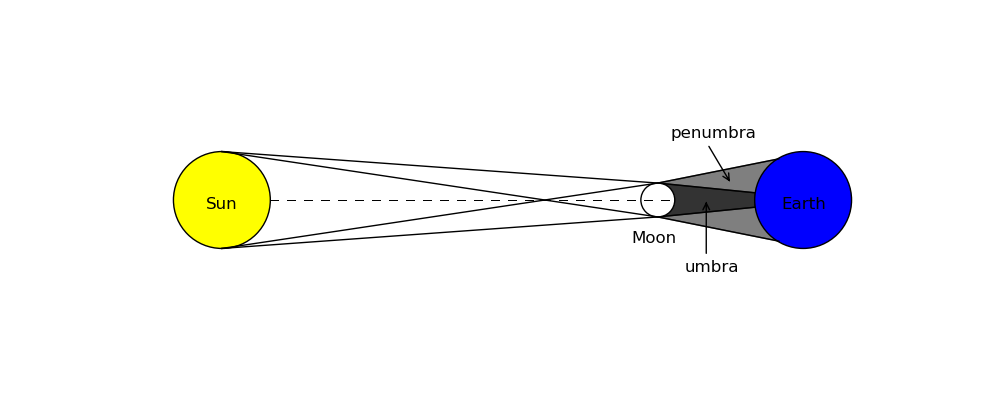
The Moon's orbit around the Earth is inclined at an angle of about 5 degrees to the ecliptic, the plane of the Earth's orbit around the Sun. Therefore, at the time of a new moon, the Moon will usually pass above or below the ecliptic. A solar eclipse can occur only if the new moon occurs close to one of the points where the Moon's orbit crosses the ecliptic, known as nodes. On average, such a situation recurrs after every six, sometimes already after five new moons. The orbits of the Earth and the Moon are both elliptical. Thus the distances between the two celestial bodies and therefore also the apparent sizes vary. This effect leads to different types of solar eclipses. If the axis of the lunar shadow crosses the Earth, the eclipse is referred to as a central eclipse. Three different kinds of central eclipses can be distinguished:
- total solar eclipse (T): The apparent diameter of the Moon exceeds that of the Sun and thus covers the Sun completely. Totality occurs only in a narrow strip on the surface of the Earth; at best, the umbra has a diameter of about 273 kilometers.
- annular solar eclipse (R): If the apparent diameter of the Sun exceeds that of the Moon, then the outermost limbs of the Sun remain visible. The umbra of the Moon is too short to reach Earth's surface.
- annular-total or hybrid solar eclipse (RT): A hybrid eclipse shifts between a total and an annular eclipse. At some points on the surface of the Earth it appears as a total eclipse, whereas at other locations it appears as annular. Hybrid eclipses are comparatively rare. Such an eclipse usually starts and ends as an annular eclipse while around mid-eclipse the umbra reaches the Earth's surface due to the spherical shape of the Earth. The diameter of the umbra is very small in a hybrid eclipse, typically about 20 kilometers and totality lasts for only a few seconds.
A solar eclipse during which Earth is crossed by the Moon's penumbra only is called a partial solar eclipse (P). Such eclipses occur mainly in the polar regions, nonetheless they can give rise to coverages of 50%, sometimes even 70% in Mediterranean regions.
Because of the relatively narrow tracks of totality only few people are able to observe a total eclipse of the Sun. Considerably broader than the Moon's umbra is its penumbra, which has the size of several thousand kilometers and which allows from more than one fourth of the Earth's surface the observation of a partial coverage of the Sun. Regarding the nomenclature, unfortunately such a partial coverage during a central eclipse is also designated a partial solar eclipse.
For historians, the most important characteristics of a solar eclipse is its coverage ratio and magnitude, both measure the amount of the coverage.
- The coverage ratio describes the ratio between the total area of the solar disk and the area covered by the Moon. The coverage ratio value reaches the maximum value of 100% during a total solar eclipse inside the zone of totality, during an annular eclipse the value peaks at slightly less than 100%.
- The magnitude of a partial solar eclipse describes the fraction of the solar diameter which is covered by the Moon. The magnitude of a total or annular solar eclipse describes the ratio between lunar and solar diameter. The value slightly exceeds unity for a total eclipse and remains slightly below unity for an annular eclipse.
During a solar eclipse, the coverage ratio and the magnitude increase slowly, reach a maximum value and decrease again.
Calculation of solar eclipses
The calculation of solar eclipses is done with the help of the so called Besselian elements. The method was developed by Friedrich Wilhelm Bessel in 1842 and was repeatedly refined since then [2]. The basic idea of the method is that the Besselian elements describe the motion of the lunar shadow on a suitably chosen, so called fundamental plane. The fundamental plane crosses the centre of the Earth and is perpendicular to the axis of the shadow cone. Comparatively few numerical parameters are sufficient to describe the movement of the shadow in this plane. Based on this, the next step is to project the shadow cone onto the Earth's surface.
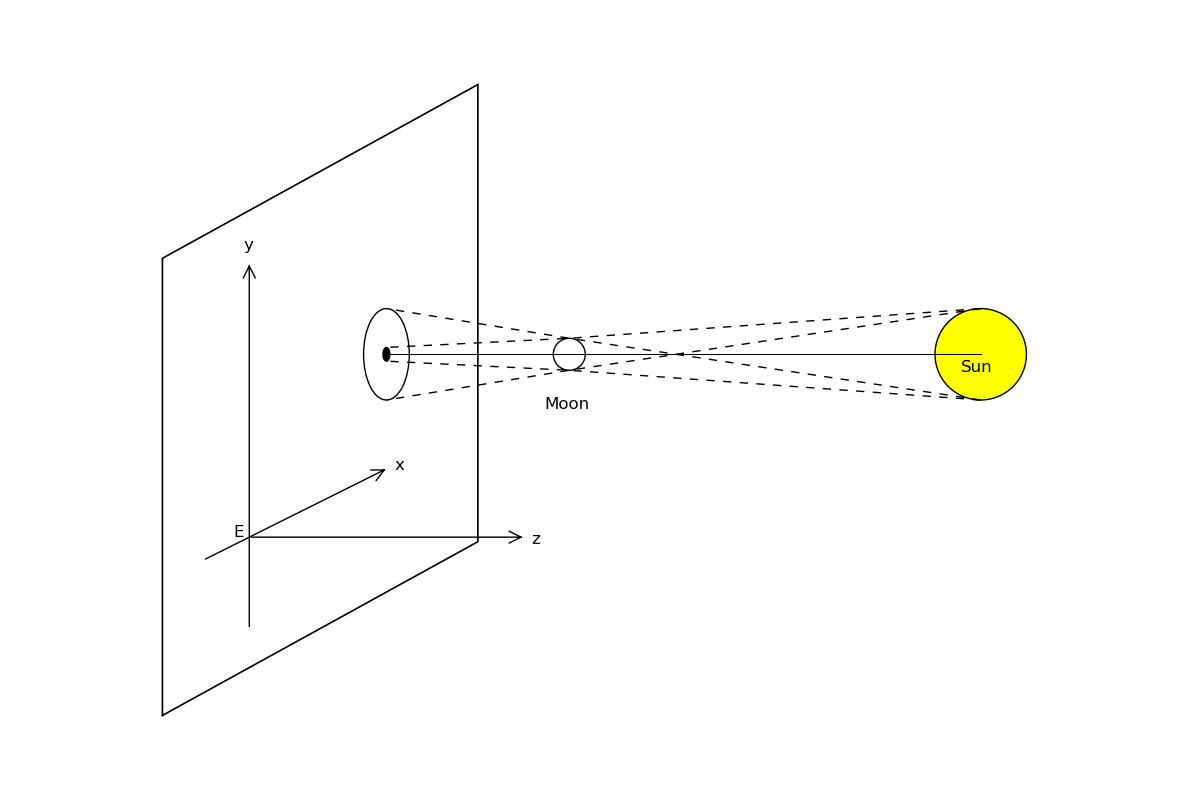
In the geometrical system shown above, the coordinates of the centre of the umbra are x and y in the fundamental plane, the coordinates of the centre of the Moon are x, y and z. The Besselian elements designate then the following quantities:
- X und Y: coordinates of the centre of the umbra in the fundamental plane
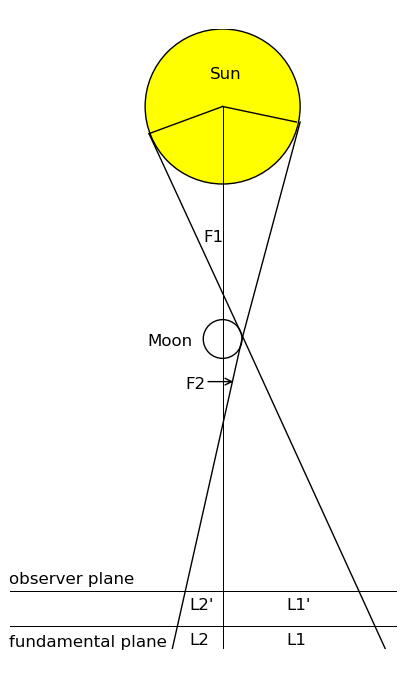
- L1: radius of the penumbra cone in the fundamental plane
- L2: radius of the umbral cone in the fundamental plane
- F1: angle between the penumbral cone and the shadow axis
- F2: angle between the umbral cone and the shadow axis
- D: declination of the point on the celestial sphere where the shadow axis points to
- M: hour angle of the point on the celestial sphere where the shadow axis points to
The equatorial radius of the Earth is used as unit of legth.
The Besselian elements are time dependent. Thus they must be specified for a timespan of a few hours to follow a solar eclipse. Two different possibilities exist to publish Besselian elements for solar eclipses: Either the values of all non-constant Besselian elements are tabulated in intervals so that interim values can be accurately interpolated; or the Besselian elements are given for a reference time t0 together with their hourly variations. This allows for the calculation of the values for other epochs as linear functions of time. Instead of linear functions a polynomial approximation can be chosen if higher accurracy is required. In that latter case, the polynomial coefficients up to the 3rd order are usually sufficient.
If one could observe a solar eclipse on the Earth's surface from the Sun, one would observe the large penumbra of the Moon - grey coloured in the following figure - and the considerably smaller umbra - shown in black - to move across the Earth:
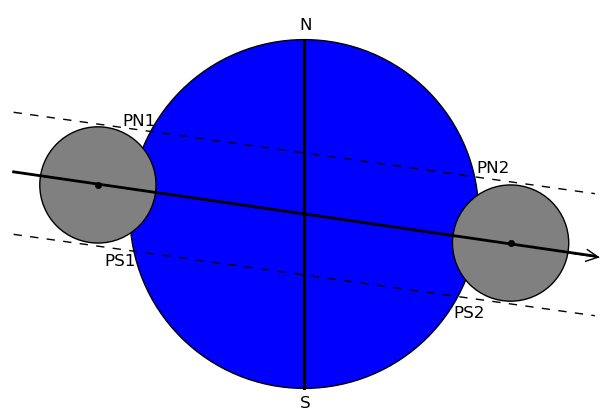
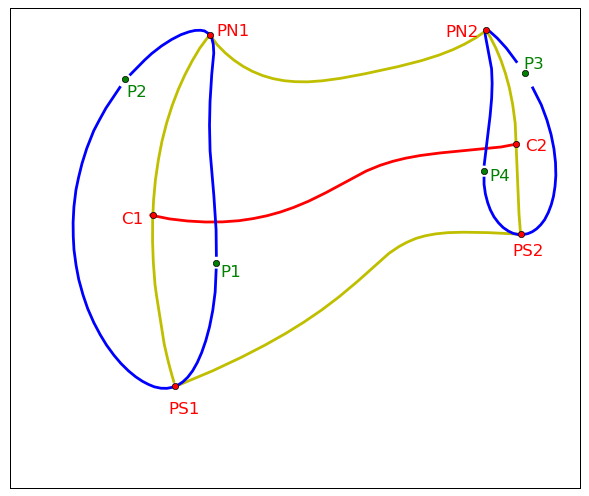
All points on the curve N-PN1-PS1-S have sunrise. For all points on the N-S meridian it is noon. All points on the curve N-PN2-PS2-S have sunset. If the just mentioned interception points are projected onto a geographical map of the Earth, the resulting regions have oval shapes: see PN1-P2-PS1-P1 and PN2-P4-PS2-P3, respectively, in the figure to the right.
ΔT and its uncertainty
For many centuries, the fundamental unit of time was the rotational period of the Earth with respect to the Sun. Universal Time (UT), also called Greenwich Mean Time (GMT), is based on the mean solar time at Greenwich. Unfortunately, UT is not a uniform time scale over historical times because Earth's rotational period gradually decreases. Therefore, the calculation of local circumstances of solar eclipses in the far past is subject to uncertainties. As the Earth rotates, tidal friction, inflicted by the gravitational attraction of the Moon and the Sun is at work. The result is a transfer of angular momentum from the Earth to the Moon. The Earth loses energy and slows down, the Moon gains energy and its distance from the Earth increases.
Today, atomic clocks are used for accurate timekeeping. Terrestrial Dynamical Time (TDT) is such an atomic time scale. Solar eclipse calculations are based on TDT, the position of the visibility area of an eclipse depends however on UT. Calculations from TDT have to be converted into UT; therefore the time difference between TDT and UT must be known. This time difference, called ΔT , which adds up to about 12 hours around 2000 BC and the uncertainty of ΔT - about 2 hours in 2000 BC - has to be taken into account in the calculations. For more information about ΔT see e.g. the webpage of Robert van Gent.
Calculations in this canon
For the calculation of the lunar and solar positions between 2500 BC and 1000 AD, the DE406 ephemeris of the Jet Propulsion Laboratory have been used, they allow for the accurate calculation of positions of the Sun, the Moon and of all the planets between 3001 BC and 3000 AD [3]. For a detailed description of the ephemeris see here. For ΔT, the polynomial expressions of Espenak[4] have been used, for an estimation of the uncertainty of these values, the formula of Huber[5] was applied. All calculations use a value for the Moon's secular acceleration of -25.826 arcsec/cy2, and the ΔT-values, which were originally derived for a secular acceleration of -26.0 arcsec/cy2, were corrected accordingly.
| year | ΔT | uncertainty (ΔT) |
|---|---|---|
| -3000 | 20h 31m | ±2h 30m |
| -2500 | 16h 30m | ±1h 42m |
| -2000 | 12h 54m | ±1h 02m |
| -1500 | 9h 44m | ±32m |
| -1000 | 7h 01m | ±11m |
| -500 | 4h 45m | ±7m |
| 0 | 2h 35m | ±5m |
| 500 | 1h 55m | ±2m20s |
| 1000 | 26m 10s | ±55s |
The calculation of solar eclipses and their local circumstances for selected places were carried out in three steps.
- The Besselian elements X0, Y0, M0, D0, L10, L20 and their hourly variations
X1, Y1, M1, D1, L11, L21, as well as tanF1 and tanF2, and the instance of maximum eclipse
have been calculated and stored for all solar eclipses occuring between 2500 BC and 1000 AD for three
different ΔT values: For a
mean ΔT , which can be calculated from the polynomial expressions, for a
lower ΔT ,
which corresponds to the mean ΔT minus the uncertainty of the ΔT-value, and for an
upper ΔT ,
which corresponds to the mean ΔT plus the uncertainty of the ΔT-value.
Example: -2000
mean ΔT: 12h 54m
upper ΔT: mean ΔT - uncertainty = 12h 54m - 1h 02m = 11h 52m
lower ΔT: mean ΔT + uncertainty = 12h 54m + 1h 02m = 13h 56m
This canon of solar eclipses is designed tp provide information about historical eclipses, thus the Besselian elements are calculated for a reference time t0 and their hourly variations are given. This linear form of calculation of the elements is sufficiently accurate because the uncertainty of the ΔT value during the timespan in question is much larger than the differences between linear and 3rd-order polynomial formulation. However, Besselian elements in polynomial form, for all solar eclipses between 2000 BC and 3000 AD, calculated with the mean ΔT-value and slightly older lunar and solar ephemeris can be found at the NASA Eclipse Web Site. - In a second step, all these solar eclipses for which a magnitude greater than or equal to 0.5 has been reached for at least one of the three ΔT-values were extracted for the ancient cities Athens, Rome, Babylon, Memphis, Theben, Alexandria and Knossos, as well as for the sites with geographical coordinates (20°N, 5°O), (20°N, 50°O), (50°N, 5°O) and (50°N, 50°O). For each of these cities the instances of onset, maximum and end of the solar eclipse, the magnitude, the times of sunrise and sunset as well as the position angles were calculated. A threshold magnitude of 0.5 was chosen in accordance with a statement in Ginzel (1899): he writes that an unpredicted solar eclipse is likely to be noticed when a magnitude of 0.75 is reached if the Sun is high in the sky or when a magnitude of 0.5 is reached if the Sun stands close to the horizon[6].
- In a third step, the visibility curves of the selected solar eclipses have been calculated: the outermost points of the eclipse, the rising and setting curves as well as the curve "maximum in the horizon" have been computed by means of the descriptions in Seidelmann [7]; the central line, the region of totality, and the isomagnitudes were obtained with the help of the formulae in Mucke & Meeus [8].
This canon contains all solar eclipses between 2500 BC and 1000 AD which were potentially noticeable at any place in the geographical region between (20°N, 5°O), (20°N, 50°O), (50°N, 5°O) and (50°N, 50°O) and thus are candidates for identifications with eclipse accounts even if the eclipse has not been predicted. Detailed eclipse predictions are found for the first time in Babylon after 300 BC. Since then, eclipse accounts can be found on a more regular basis that mention solar eclipses that reached magnitudes of less than 0.5.
History of solar eclipse calculations
In the 19th century, astronomical problems started to get some focus in classical and ancient studies. Accounts of lunar, planetary and eclipse observations had been found and waited to be chronologically assessed. For such purposes, Ginzel published 1899 a canon of solar eclipses between 900 BC and 600 AD[10]; this work remained a milestone as of today for all studies involving eclipses that have been published with their main purpose to be useful for chronological aims. Ginzel collected eclipse accounts of ancient writers and suggested identifications; his book contains maps for the regions of classical antiquity where the tracks of totality of solar eclipses are printed for each century between 900 BC and 600 AD.
In 1986, Stephenson & Houlden published a canon of solar eclipses for East Asia covering the timespan between 1500 BC and 1900 AD[11]. For the calculation of the position of the Moon, the J=2 lunar ephemeris of the International Astronomical Union (1968) were used[12], although adapted to a more up-to-date value of the lunar acceleration of -26"/cy2. Their atlas contains maps showing the tracks of totality for each eclipse and for selected longitudes the corresponding latitudes, the local time, and the altitude of the Sun.
As of now, the last canon of eclipses that was designed for the particular needs of historians was the one published by Salvo de Meis[13] in 2002. His canon contains calculations and maps of the areas of visibility for solar and lunar eclipses, which are mentioned in ancient sources, starting in 763 BC and ending in 1740 AD. For each eclipse the citation in English translation, and the time and the magnitude are given for the site(s) of observation. The calculations in the de Meis canon are based on the VSOP87[14] (for the Sun) and ELP2000-ephemeris[15] (for the Moon) of the Bureau des Longitudes in Paris.
The Babylonian solar and lunar eclipse accounts and calculations that are passed down were published by Huber & de Meis[16] in 2004. The calculations of the ephemeris were based on computer programs that used the tables of Tuckerman[17] and Goldstine[18]. Huber included a few more perturbation terms, however. The maps with the areas of visibility were made by S. de Meis, based on the same ephemeris as in his canon[13]. For each identifiable eclipse Huber specifies: the date in the babylonian calendar, universal time, instant of onset and the corresponding altitude, instant of maximum eclipse and the corresponding altitude, end of the eclipse and the corresponding altitude, the magnitude, duration of a possible totality, as well as the sunrise and sunset times.
Apart from Ginzel's canon, all the above mentioned works contain exclusively maps of eclipses that are documented in written form. On the contrary, the present electronic canon of solar eclipses is set up very similar to Ginzel's canon. It contains maps of all solar eclipses that were potentially noticeable in the chosen geographical area, i.e. which reached a magnitude of at least 0.5, between 2500 BC and 1000 AD.
The following excerpt from the compiled tables illustrates how the canon is organised:
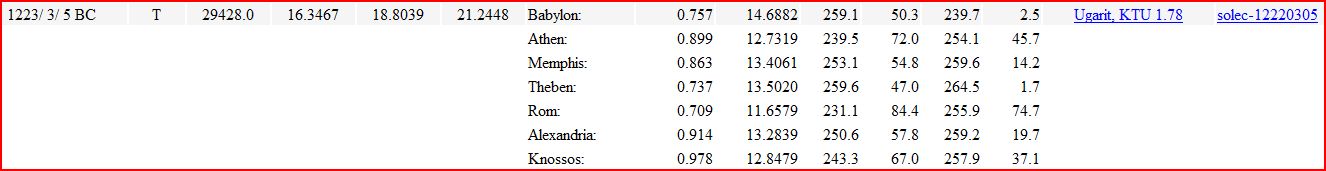
For each solar eclipse the following quantities are given:
- date,
- type,
- ΔT value in seconds,
- onset, maximum and end of the eclipse.
For the cities Athens, Rome, Babylon, Memphis, Theben, Alexandria and Knossos the following information is provided:
- maximum magnitude,
- instant of maxium eclipse at the site
- entrance angles,
- exit angles.
If a solar eclipse is documented in written form, the information about the source follows, which is directly clickable - the citation is then shown in the original language (as far as possible) and in English translation:

For solar eclipses after 100 AD only one single citation was selected - usually the one giving the most details about the eclipse - even if more than one source mentions the corresponding eclipse. If the citations are not shown properly or if the file is not opened at the correct position (this may be browser dependent!), two files containing all eclipse citations can be opened and downloaded here: babfinst.pdf and eclipsecitations.pdf. A catalogue containing numerous citations for individual eclipses was compiled by Gorodezkii Michail Leonidovich.
For each solar eclipse, a map of the geographical area between (20°N, 5°O), (20°N, 50°O), (50°N, 5°O) and (50°N, 50°O) is provided. If an eclipse is documented in written form, further detail plots for Italy, Greece and Asia Minor, Egypt and the Near East are provided. The maps are further discussed in the section area of visibility of a solar eclipse.
Besides the above mentioned publications about solar eclipses whose main focus lies on historical eclipses, numerous other purely astronomical publications do exist which list all solar eclipses that are visible somewhere on Earth within certain timespans: The publications of Oppolzer[19], Mucke & Meeus[20], and Espenak[21] belong into this category.
Data and data download
If you download the following data and use them in a publication, please refer to the following paper and the adress
of this website as the origin of the data:
R. Gautschy, Sonnenfinsternisse und ihre chronologische Bedeutung: Ein neuer Sonnenfinsterniskanon
für Altertumswissenschaftler, Klio 94, Vol. 1, 2012, p. 7-17.
The following table contains catalogues for the cities Athens, Rome, Babylon, Memphis, Theben, Alexandria and Knossos showing all solar eclipses for which the Sun was covered by the Moon for 50%, 60%, 70%, 80%, 90% or 100%; these lists contain the following quantities:
- In the first three columns: The calendar date in the succession year, month, and day (years BC are counted astronomically, i.e. -999 equals 1000 BC),
- type of solar eclipse,
- ΔT value in seconds (mean ΔT),
- maximum magnitude obtained at the site,
- onset time in true local time,
- instant of maximum coverage in true local time,
- end of eclipse in true local time,
- true local time of sunrise,
- true local time of sunset.
Sometimes a maximum eclipse occured before sunrise or after sunset. Therefore, the two columns "maximum magnitude" and "instant of maximum coverage" contain two values, each seperated by a diagonal slash. The first magnitude value gives the actually observable maximum magnitude in addition to the hypothetical maximum values after the slash.
| site | 50% coverage | 60% coverage | 70% coverage | 80% coverage | 90% coverage | 100% coverage |
|---|---|---|---|---|---|---|
| Athens | here | here | here | here | here | here |
| Rome | here | here | here | here | here | here |
| Babylon | here | here | here | here | here | here |
| Memphis | here | here | here | here | here | here |
| Theben | here | here | here | here | here | here |
| Alexandria | here | here | here | here | here | here |
| Knossos | here | here | here | here | here | here |
Area of visibility of a solar eclipse
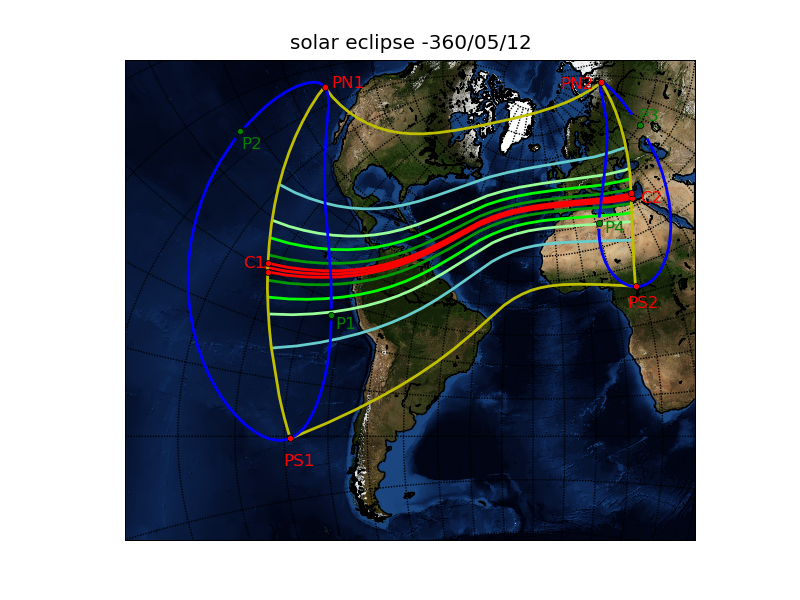
This figure shows the area of visibility of the annular-total solar eclipse of May 12th 361 BC, which is documented in written form in Plutarch, Vita Dionis XIX.4. The Moon's shadow hits the Earth's surface for the first time at the green point P1: The solar eclipse starts. The two red points PN1 and PS1 designate the northernmost and southernmost point where the solar eclipse ceases to be observable. For all points on the blue curve between PN1, P1, and PS1, the solar eclipse starts at sunrise, i.e. the whole eclipse is observable. For all points along the yellow curve, between PN1, C1, and PS1, the maximum coverage takes place at sunrise, i.e. only the second half of the eclipse can be observed. For all points on the blue curve between PN1, P2, and PS1, the solar eclipse ends at sunrise, i.e. no part of the eclipse is observable. Starting on the yellow curve PN1-C1-PS1 the locus of the zone of totality (red lines) as well as the loci of isomagnitudes (yellow and various green colour shades) are plotted. For the zone of totality, the northern limit, the central line and the southern limit is drawn. The green isomagnitudes show where the Sun was covered up to 90%, 80%, 70%, 50%, the yellow isomagnitudes show where 0% of the Sun was eclipsed. At the green point P4, the Moon's shadow leaves the Earth's surface: The solar eclipse ends. For all points on the blue curve between PN2, P4, and PS2, the eclipse ends exactely at sunset. For all points on the yellow curve between PN2, C2, and PS2, the maximum coverage takes place at sunset, i.e. only the first half of the eclipse can be observed. For all points on the blue curve between PN2, P3, and PS2, the eclipse starts at sunset, i.e. no part of the eclipse is observable.
The maps provided by this canon of solar eclipses are restricted to the geographical area between (20°N, 5°O), (20°N, 50°O), (50°N, 5°O) and (50°N, 50°O); this means that the whole area of visibility of the solar eclipse is never shown such as in the figure above.
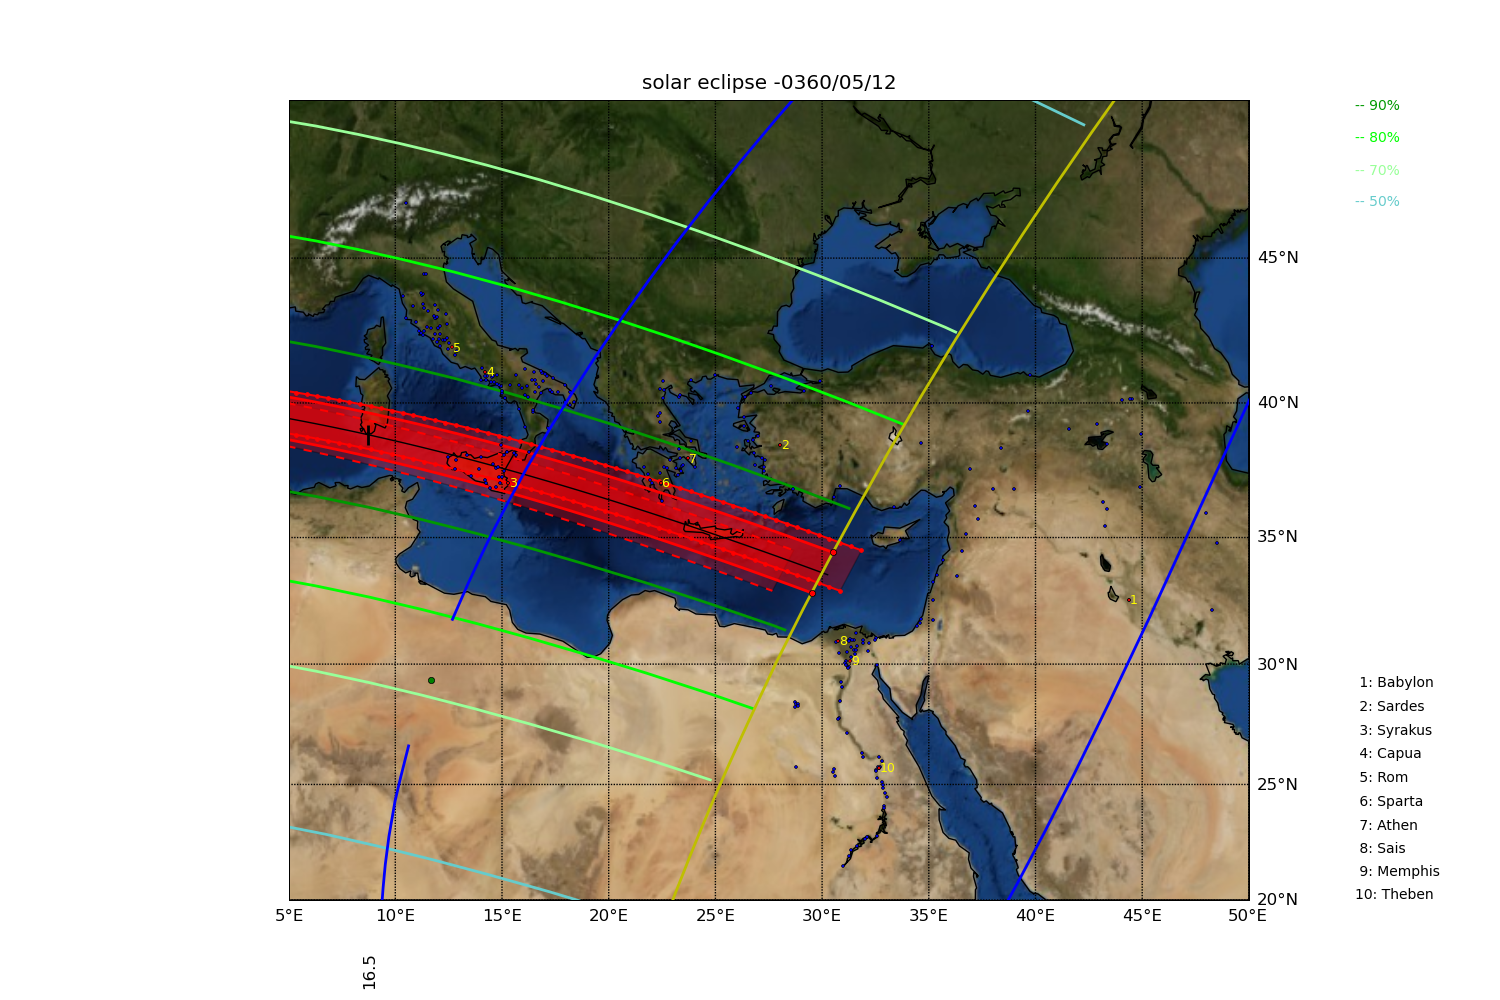
The two red continuous lines show the zone of totality if the calculations are done with the mean ΔT-value. The green isomagnitudes which designate the 90%, 80%, 70% or 50% eclipse of the Sun by the Moon, are usually calculated using the mean ΔT-value. The same applies for the blue sunrise and sunset curves as well as for the yellow curve delineating the "maximum in the horizon" curve. Thus the red continuous lines end at the yellow "maximum in the horizon" line, while the red dashed and red dot-dashed lines end slightly behind or before the yellow line. The red dashed curves show the zone of totality if the calculations are done with the lower ΔT-value, the red dot-dashed ones if the upper ΔT-value is used. The deviations of the dashed and dot-dashed curves from the continuous lines illustrate the uncertainties of the calculations, which are due to the uncertainty of the ΔT-value. For the adopted example, this means that with certainty the zone of totality ran over Sicily and Crete, but whether the Sun was covered 100% or only 96% in Sparta (number 6) cannot be claimed with certainty. The black line is the central line, calculated with the mean ΔT-value. Black tickmarks on the central line show in constant time intervals of 15 minutes the Greenwich mean time; these times apply exclusively to the central line and ought to serve as approximate temporal orientation. If in the defined geographical region a limiting magnitude of 0.5 is not reached when calculating with the mean ΔT value, but if this is the case when using the upper or lower ΔT-value, then all sunrise and sunset curves, as well as the isomagnitudes are drawn with dot-dashed or dashed lines, respectively.
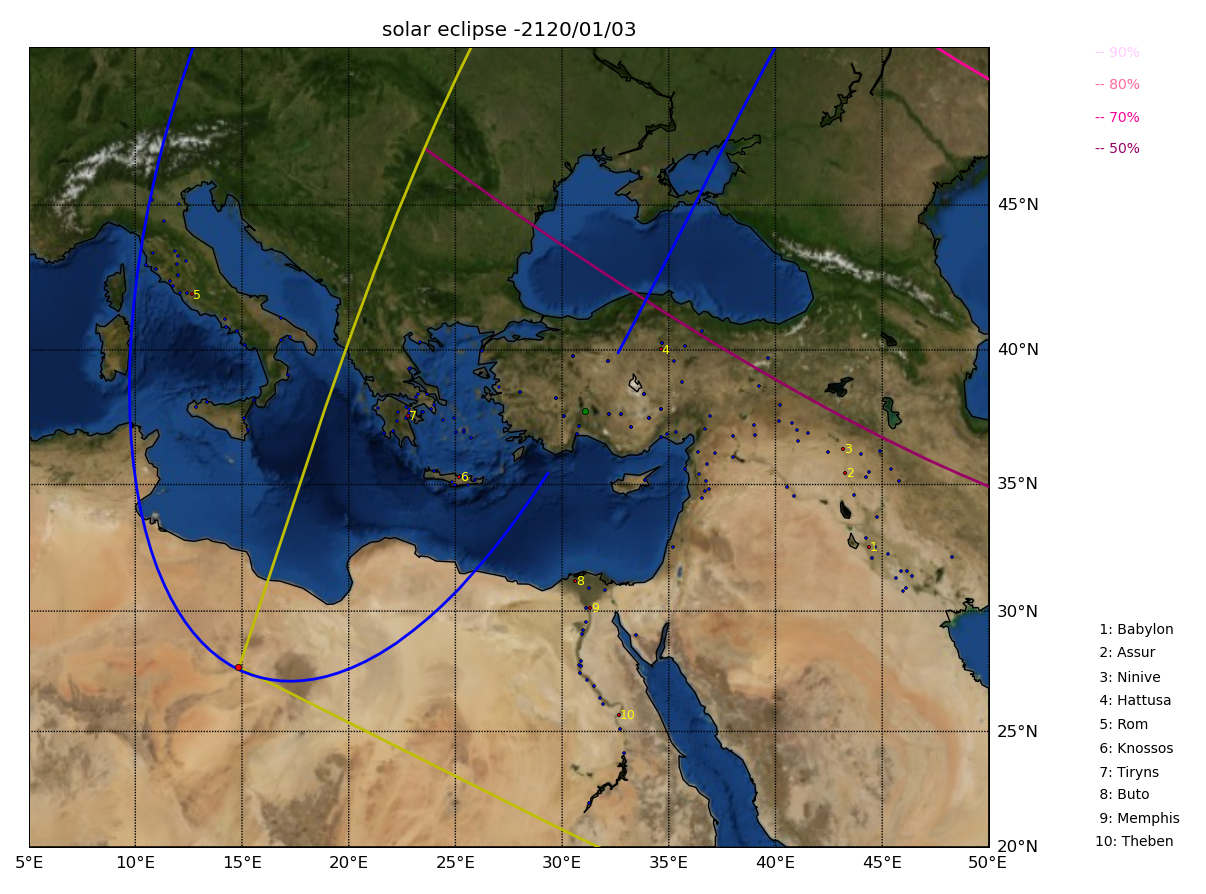
If the solar eclipse is partial, as shown in the above map, the isomagnitudes are drawn in different shades of purple.
For each solar eclipse, numerous sites which were important during the corresponding period, are marked with small blue circles; the names and geographical coordinates can be found in the sites register. Ten important sites are drawn in red, tagged with a number and the names of the sites are labelled on the right of the map.
For those solar eclipses in the regions Italy, Greece and Asia Minor, Egypt and the Near East for which written accounts are preserved, additional more detailed plots are available. The following figures show examples for each region:
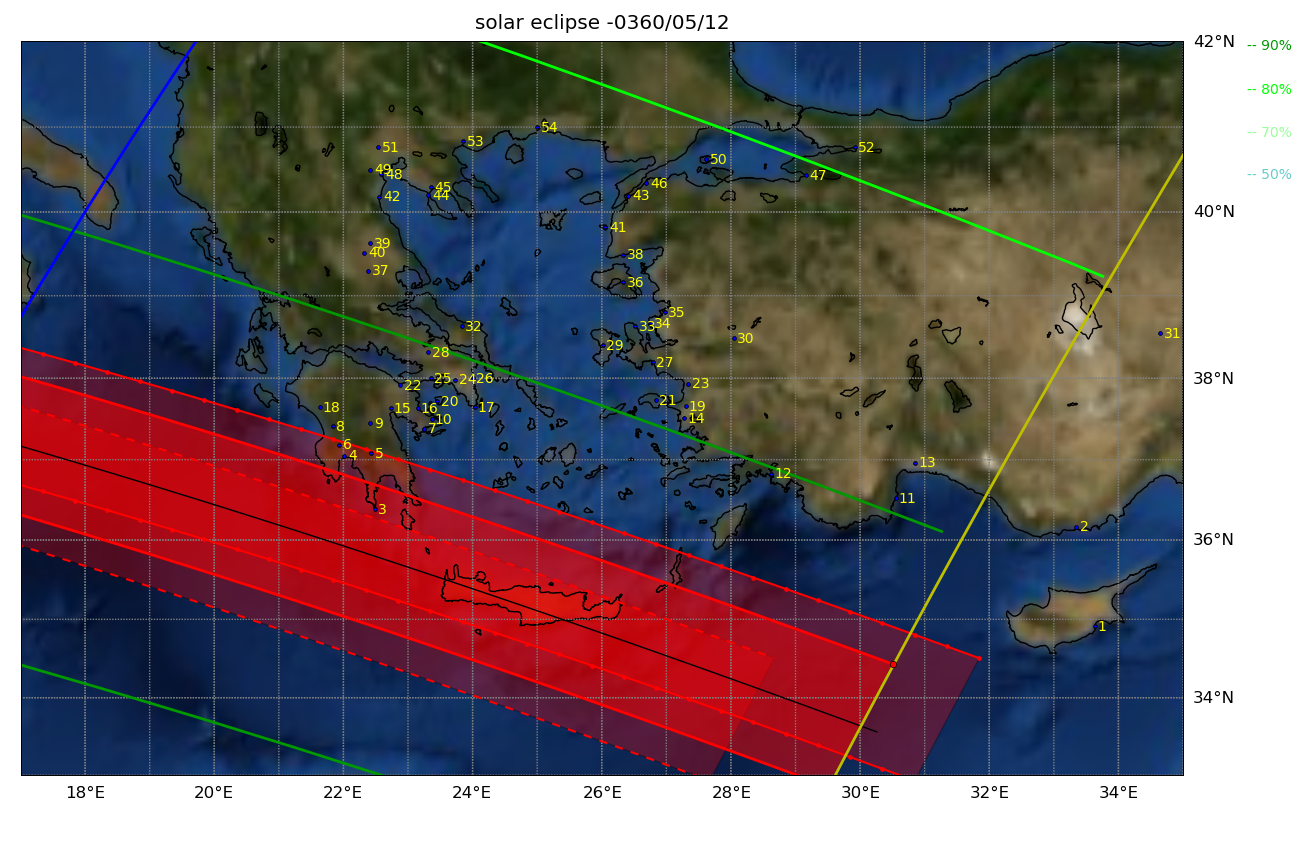


The smooth division of the area in steps of 1° should permit to find sites easily that are missing in the sites register. The sites being labelled with numbers vary depending on the period in question, their names can be found in the sites register.
Due to the size of the files, the canon of solar eclipses listed in the following table is subdivided into centuries. The link in the first column leads to a table containing all potentially noticeable solar eclipses during the respective century. In the last column, .zip-files containing the calculated data can be downloaded. The last row leads to the list of solar eclipses that are documented in written form but which did not reach the limiting magnitude of 0.5 in the chosen geographical region.
Bibliography
- 1 J. Meeus, Mathematical Astronomy Morsels, Willmann-Bell 1997, 88ff.
- 2 F. W. Bessel, Astronomische Untersuchungen II, Königsberg 1842 (online).
- 3 E. M. Standish, JPL Planetary and Lunar Ephemerides, DE405/LE405, Jet Propulsion Laboratory Interoffice Memorandum 312.F, 1998.
- 4 F. Espenak, Polynominal expressions for deltaT, http://eclipse.gsfc.nasa.gov/SEhelp/deltatpoly2004.html
- 5 P. J. Huber, Modeling the Length of Day and Extrapolating the Rotation of the Earth, Journal of Geodesy 80, 2006, 283-303.
- 6 F. K. Ginzel, Über die geringste Phase, welche bei der Beobachtung von Sonnenfinsternissen mit freiem Auge noch gesehen werden kann, Astronomische Nachrichten 118, 1887, 119-122.
- 7 P. K. Seidelmann (Hrsg.), Explanatory Supplement to the Astronomical Almanac, Sausalito 1992, 421-471.
- 8 H. Mucke & J. Meeus, Canon of solar eclipses -2003 to +2526, Wien 1992, XXXIII-LI.
- 10 F. K. Ginzel, Spezieller Kanon der Sonnen- und Mondfinsternisse für das Ländergebiet der klassischen Altertumswissenschaften und den Zeitraum von 900 v. Chr. bis 600 n. Chr., Berlin 1899.
- 11 F. R. Stephenson & M. A. Houlden, Atlas of historical eclipse maps. East Asia 1500 BC - AD 1900, Cambridge 1986.
- 12 Transactions of the International Astronomical Union 13B, 48, 1968.
- 13 S. de Meis, Eclipses. An astronomical introduction for humanists, Serie Orientale Roma XCVI, Rom 2002.
- 14 P. Bretagnon & G. Francou, Planetary theories in rectangular and spherical variables. VSOP87 solutions, Astronomy and Astrophysics 202, 1988, 309-315.
- 15 J. Chapront & G. Francou, Lunar Solution ELP version ELP/MPP02; online available here.
- 16 P. J. Huber & S. de Meis, Babylonian eclipse observations from 750 BC to 1 BC, Mailand 2004.
- 17 B. Tuckerman, Planetary, Lunar and Solar Positions 601 B.C. to A.D. 1, Memoirs of the American Philosophical Society Vol. 56, Philadelphia 1962.
- 18 H. H. Goldstine, New and Full Moons 1001 B.C. to A.D. 1651, Memoirs of the American Philosophical Society Vol. 94, Philadelphia 1973.
- 19 Th. v. Oppolzer, Canon der Finsternisse, Wien 1887 (reprint Dover 1960).
- 20 H. Mucke & J. Meeus, Canon der Sonnenfinsternisse -2003 bis +2526, Astronomisches Büro, Wien, 2. Auflage, 1999.
- 21 F. Espenak, Five Millennium Canon of Solar Eclipses: -1999 to +3000, 2006, online available here.
 This work was supported by a Marie Heim-Vögtlin grant of the Swiss National Science Foundation.
I thank Alfred Gautschy, Bill Gray, Peter J. Huber, Kurt Locher, Salvo de Meis and Robert Nufer who contributed valuable comments at various stages of this project.